What is energy benchmarking?
Energy benchmarking is a valuable process for both building owners and occupants to better understand and quantify how their buildings are using resources such as energy and water. It can be used to compare energy and cost performance year-over-year, compare to similar buildings, and to better identify when a property is underperforming.
Each year, the District of Columbia collects and publishes detailed energy and water performance data from the largest buildings in the city. Additionally, the District’s Building Energy Performance Standards (BEPS) use energy benchmarking data as a baseline and establish minimum energy performance thresholds. Benchmarking is essential in identifying the level of action potentially required under BEPS.
Reviewing your benchmarking data, after ensuring its accuracy, will allow you to understand where there is opportunity to improve performance.
Every three years, building owners or their designees are required to perform third-party verifications of their benchmarking data and submit the verification with their benchmarking reports. The first deadline for third-party verification is on July 1, 2024 (note that DC Council passed emergency legislation which extended the deadline for this cycle only from April 1, 2024 to July 1, 2024). The Hub has created a sample scope of work (SOW) and companion how-to-guide to help make it easier to navigate the process.
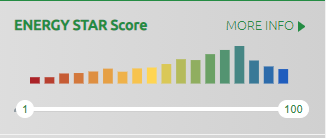
A building cannot be judged by its energy usage alone. The ENERGY STAR score considers multiple factors such as climate, occupant density, and hours of operation. ENERGY STAR scores range from 1–100. Higher scores indicate better building performance. Only buildings that submit whole-building data, including tenant usage, are eligible to receive an ENERGY STAR Score.
Understanding your energy metrics
The District requires the use of U.S. Environmental Protection Agency’s (EPA’s) ENERGY STAR Portfolio Manager for building owners to report annual benchmarking data. It is a free, web-based tool that requires information on a building’s utility data, physical characteristics, and usage information. Portfolio Manager analyzes the data and provides metrics to help owners and managers identify where their buildings rank when compared to other similar properties.
ENERGY STAR score
Portfolio Manager reports many metrics that an owner can use to understand their building’s performance. The best place to start is the ENERGY STAR score. The ENERGY STAR score compares the energy performance of your building to others of a similar type. The ENERGY STAR score is a national metric—a score of 50 represents the national median per property type. BEPS, however, evaluates buildings against the District’s medians per property type.
In order to understand how your building ranks in the District and whether or not you are required to take action under BEPS, compare your building’s ENERGY STAR score to the 2021 Building Energy Performance Standards. If your score is lower than the standard for your property type, you should explore the compliance options available to improve your building’s performance. If your score is above the standard for your property type, you should continue to monitor performance to ensure it remains so.
Site Energy vs. Source Energy
| Site Energy | This is the amount of annual energy consumed on site at a building, regardless of the source(s). This is the amount read on your utility meters. For example, a 1,000-watt electric baseboard heater uses 1,000 watts of electricity on site at the building. |
| Site EUI | This is calculated by dividing your site energy use by the building’s gross floor area. |
| Source Energy | This is the amount of energy used at a building plus the amount of losses that take place during the generation, transmission, and distribution of the energy from the source to your building.For example, that same 1000-watt electric baseboard requires roughly 2,800 watts of source energy to generate and deliver the electricity to power it. |
| Source EUI | This is calculated by dividing your source energy use by the building’s gross floor area. |
Note: ENERGY STAR publishes national average ratios for converting Site Energy to Source Energy.
Source Energy Use Intensity
If you did not receive an ENERGY STAR score, or wish to review additional metrics, you should review your building’s source energy use intensity (EUI). Source EUI is a measure of the annual energy used on-site at your property (electricity, gas, and fuel oil) plus the amount of energy required to generate, transmit, and distribute that energy to your site divided by the total building area. Dividing by square footage allows you to compare similar buildings of various sizes. Unlike an ENERGY STAR score, higher EUIs indicate worse energy performance. Your goal should be to reduce source EUI to improve energy performance.
Some property types use more energy than others, so you should only compare energy use of similar buildings to each other. Commercial offices tend to use more energy than multifamily buildings. Hospitals will tend to use much more energy than K-12 schools. The differences result from the hours of operation, the type of equipment inside, and the specific building systems installed.
Just like an ENERGY STAR score, you can compare your building’s source EUI to the District medians reported by property type to see how your building compares.
Accessing your energy data
ENERGY STAR Portfolio Manager
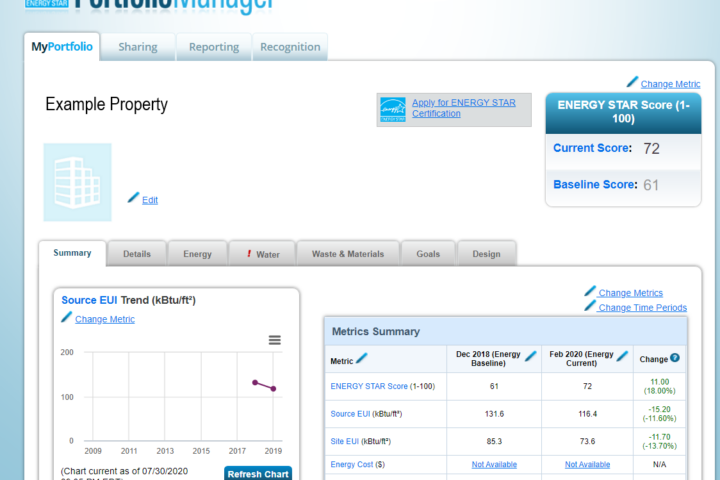
Portfolio Manager creenshot courtesy of Steven Winters & Associates
If you have previously complied with the District’s energy benchmarking requirements you should have a Portfolio Manager account where the data is stored. Portfolio Manager provides a dashboard of simple visualizations. Here, you can view how energy metrics like ENERGY STAR score, source EUI, and site EUI change over time. It also allows you to dig into more granular energy data analysis. Metrics like ENERGY STAR score, source EUI, and site EUI are annual metrics, which consider energy usage over a full calendar year rolled up into a single metric. However, more insights may be gleaned from viewing monthly energy data.
When viewing a property in Portfolio Manager, you can click on the Energy tab to view each meter that is used to compute energy metrics. Energy data is plotted on a chart to view month-by-month changes. The example below shows a typical gas-heated multifamily building, with higher gas usage in the heating season. The minimums of the gas curve represent “baseload” gas usage such as domestic hot water heating, laundry, and cooking gas, which is relatively constant throughout the year. This example building shows relatively flat electricity usage, though you may see spikes in electricity in the summer months to indicate cooling usage. You also have the option to download the energy data for further analysis.
Metrics like ENERGY STAR score, source EUI, and site EUI are annual metrics, which consider energy usage over a full calendar year rolled up into a single metric. However, more insights may be gleaned from viewing monthly energy data.
When viewing a property in Portfolio Manager, you can click on the Energy tab to view each meter that is used to compute energy metrics. Energy data is plotted on a chart to view month-by-month changes. The example below shows a typical gas-heated multifamily building, with higher gas usage in the heating season. The minimums of the gas curve represent “baseload” gas usage such as domestic hot water heating, laundry, and cooking gas, which is relatively constant throughout the year. This example building shows relatively flat electricity usage, though you may see spikes in electricity in the summer months to indicate cooling usage. You also have the option to download the energy data for further analysis.
DC’s interactive energy benchmarking map
Portfolio Manager screenshot courtesy of Steven Winters & Associates
You can also view annual benchmarking data on the District’s data visualization platform. This map transforms raw data spreadsheets, focused on individual buildings, into a visualization tool that better tells the story of what energy use across the District’s buildings looks like. The colors of the dots on the map represent the relative scale for the selected metric that you are currently viewing. For example, each dot is colored based on where that building’s ENERGY STAR score falls on the color scale for ENERGY STAR score.
The buildings with lower ENERGY STAR scores are represented as a red dot, whereas the buildings with higher ENERGY STAR scores are blue. This allows you to see at a glance how various properties are performing.
How to use the Energy Benchmarking DC map
Search for your property by entering the address or selecting it from the map. The tool displays fifteen different data fields, including property name, property type, compliance status, property size, ENERGY STAR score, and the amount of electricity or fuel consumed annually. For more details on how that metric is defined, see the glossary and FAQ page at the bottom of the map page.
Take action
In addition to enabling peer comparisons, energy benchmarking helps evaluate year-to-year changes at your property. Tracking over time can help assess the effectiveness of capital or operational changes. It can also be used to identify errors in the data collection. If multiple years of data are available, note any significant changes in performance over time (accounting for weather or other events that may affect energy performance). If the energy performance is worsening over time, it may indicate that equipment is in need of an upgrade, or that there are other opportunities for improvement.
If you have a building engineer, operator, or superintendent on site, discuss how the current systems are operating and whether there are ways to save energy. There may be training opportunities for your building staff to improve performance. Depending on staff experience, it may be beneficial to hire an outside consultant to perform an energy audit of your building systems. This study can provide you with an inventory of your systems and an assessment for ways to reduce energy usage and save money, with a combination of operational and capital improvements.
If you hired a benchmarking vendor, they may have access to other reports or tools to obtain a more comprehensive picture of a property—often available for no additional cost. Some benchmarking vendors provide additional dashboards for a more user-friendly experience in viewing and understanding your energy usage.