With the District of Columbia’s Building Energy Performance Standards (BEPS) as law, and decarbonization efforts increasingly a priority, it is more important than ever that building owners and design teams understand how to design a building for optimal performance. BEPS set minimum thresholds for energy performance for existing buildings. These standards are based on and measured against a building’s demonstrated energy performance, as shown in the building’s benchmarking data. Noncompliance with BEPS targets may not only result in mandated improvements but also a loss of property’s competitiveness. In addition, decisions made today will affect performance under all future cycles of BEPS. Recognizing this, building owners and design teams, both architectural and engineering, should target improved energy performance in new construction and major renovation projects now. This guide outlines how to design for various BEPS-related metrics, including site energy use intensity (site EUI) and ENERGY STAR score.
This resource provides:
- Technical guidance for the early design phases, pre-design, and conceptual design, which are the most critical for understanding how to optimize building performance.
- A general description of how energy modeling can be used to optimize, maintain, and verify energy performance targets throughout the project phases.
- Resources for a design team to reference to support high-performance building design.
Energy performance target summary
When planning for higher levels energy performance, a project team must define an energy performance target. This guide recommends using site EUI as the performance metric to track throughout the project. Site EUI is simply the amount of energy used on site—that would be reported on utility bills from meter readings and a simple output from an energy model—divided by the total conditioned building area (unconditioned parking garages would be excluded from this area, for example). The intent is to reference and further refine this energy performance target throughout the design process.
However, while the energy performance target discussed in this guide uses the site EUI metric, the District’s BEPS regulations reference ENERGY STAR scores. ENERGY STAR scores are calculated based on source energy and various building specific operational characteristics, such as density and operational hours, as an example. This guide provides additional technical guidance on relating site EUI energy performance targets to ENERGY STAR scores.
Site Energy vs. Source Energy
Definitions from the ENERGY STAR Portfolio Manager Glossary
| Site EUI | The site energy use divided by the property square foot. |
|---|---|
| Source Energy Use | The total amount of all the raw fuel required to operate your property, including losses that take place during generation, transmission, and distribution of the energy. Below is an outline of recommended actions at each phase of the design process. They provide the owner and design team critical information relative to meeting energy performance targets of a new or renovated building. |
| Source EUI | The source energy use divided by the property square foot. |
| Site Energy Use | The annual amount of all the energy your property consumes on-site, regardless of the source. It includes energy purchased from the grid or in bulk (which are the amounts on utility bills), as well as renewable energy generated and consumed on-site |
| Project Phase | Actions |
|---|---|
| Pre-Design | Establish an energy performance target. This target, which should be determined by the building owner with guidance from other stakeholders, is just a starting point for the project’s design team, and should be re-evaluated at every phase, particularly in design. The energy performance target must be communicated to all design team members; it is most effective when included in the project’s Owner’s Project Requirements. The target can be set for both achieving a certain ENERGY STAR score or a site EUI. |
| Conceptual Design | Investigate passive load reduction opportunities with a simple box model. Refine the energy performance target. The simple box (or shoebox) modeling effort is intended to understand the loads which occur based on the building program and building location. At this stage, the model is investigating ways to most effectively reduce the loads that are inherent to the specific building use such as occupancy, plug loads, ventilation requirements, climatic conditions and thermostat/comfort requirements, and building schedule. Mechanical system options should not be evaluated at this stage. Refinements of the building operation requirements should feed back into a refined energy performance target calculation. |
| Schematic Design | Reduce and refine building loads to determine building system options. At this stage, the project team should understand the major loads which are driving energy performance in the building. During schematic design, energy modeling can be used to evaluate mechanical system options and envelope strategies to meet the needs of the building occupants. A more detailed model than the simple box model can help refine these loads and evaluate system options. The energy performance target can also be updated, if necessary, with any changes in building use characteristics. |
| Design Development | Maintain energy performance target throughout system designs. As the building details are further developed, the project team must ensure the high-level performance targets for each building system are maintained. This includes reducing infiltration and thermal bridging in the envelope design, reducing ductwork static pressure and leakage, and correctly sizing mechanical systems, among others. Systems should be evaluated individually for performance and energy modeling should be used to confirm the energy performance target is being maintained. |
| Construction Documents | Validate energy performance target with whole building design. The final details and coordination of a project come together in construction documents. Performance of each system and the whole building together should be validated during construction documents through energy modeling. |
| Construction Administration | Verify energy performance targets through testing, inspections, and commissioning. During the construction phase, an energy model serves as a reference to evaluate adherence with submittals, a substitution or value engineering request, or any other design or field change. In addition, a commissioning agent should verify that the systems and equipment are installed and operating per the design specifications. |
| Building Operations | Prove energy performance target with benchmarking. Finally, during building occupancy, the building operations team should measure actual building performance and share with the design team. The building operations team should provide benchmarked utility data to confirm performance and help troubleshoot any issues. Lessons learned should be documented for reference on future projects. |
Technical guidance
Pre-design – establish an energy performance target
To develop an initial energy performance target for new construction and major renovation projects which meet or exceed the current or projects BEPS thresholds, a design team can use the U.S. Environmental Protection Agency’s Target Finder. This online tool generates source and site EUIs relative to an ENERGY STAR score. An ENERGY STAR score is calculated based on building energy performance (source EUI), location, and other building specific characteristics. The design team can use Target Finder with minimum building specific characteristics, but it should be refined throughout the project phases as more detail is defined for the project.
Using Target Finder in Pre-Design
There are detailed online instructions on how to use Target Finder. Below is a quick-guide outline to using the tool:
- About your design project. Fill out general project information in this first section. At a minimum, the tool needs the following data points:
- Country, state, and postal code of project location
- Project type. If there are multiple uses in the building, choose the primary or largest use type by area here. Additional use types can be added in the next section.
- Gross floor area. This should include all areas within the thermal envelope, parking garages should be excluded. If more there is more than one space type, this number should be the total area of all space types.
- Property use details. In early design phases there are often many undefined project details. To make estimates, the project team should request the building owner provide assumptions based on other, similar buildings. The tool has pre-defined defaults that can be used as placeholders and should be updated for accuracy as the project moves forward.
- Estimated design energy. During the pre-design phases, it is assumed that an energy model has not yet been developed and therefore, that the optional inputs for Estimated Design Energy are not yet available. If this is the case, indicate “I don’t have (or don’t want to) enter energy estimates” here. In subsequent design phases, this value can be updated based on modeled results, along with other building operational assumptions listed in Property Use Details above.
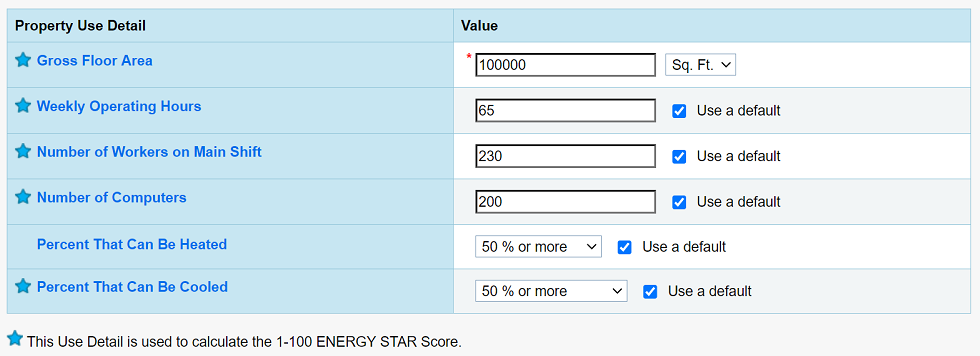
Portfolio Manager screenshot courtesy of Steven Winter Associates, Inc.
- Target. Input the ENERGY STAR target score for your building here. Target ENERGY STAR scores should be based on compliance with future BEPS thresholds and an assumption of some amount of inherent reduction that will occur during the design, construction, and operational phases. Set the ENERGY STAR target score slightly above the desired end result.
- View results. Once the above inputs have been confirmed, click on the “View Results” button at the bottom of the page.
The results of the above steps produce an average energy performance of buildings which have achieved the targeted ENERGY STAR score, and therefore estimates performance, including source and site EUIs, required against comparable buildings. However, the required source and site EUIs for any specific project to achieve the target ENERGY STAR score must be verified as soon as modeled results are available and the above exercise should be repeated as updated or more accurate information becomes available.
Confirming Site EUI design targets
A building’s ENERGY STAR score is derived from its estimated source EUI, and the Target Finder tool uses assumed variables to convert source EUI to site EUI. Site EUI is the metric typically used by design teams to track energy performance throughout the project. In order to use the resulting site EUI metric as a starting place for a design target, design teams should be familiar with the assumptions in the tool which were used to convert source EUI to site EUI, as these assumptions can greatly influence estimated performance. The tool makes assumptions based on the fuel mix of available source energy, which might differ from that of the project.
Design teams should also be familiar with additional variables Target Finder uses to convert source energy to site energy, since this can greatly influence performance. The two variables in Target Finder needed to convert source EUI to site EUI are:
- Site-to-Source Energy Conversion Factors
- Assumed Site Fuel Mix Ratios
Target Finder applies the following formula to calculate the Site EUI equivalent to the Source EUI associated with the targeted ENERGY STAR score:
| Site EUI= | Total source EUI |
| (Site electric fuel mix ratio*Site-source electric conversion factor)+(Site gas fuel mix*Site-source gas conversion factor) |
Limitations of Target Finder |
|---|
| A design team must understand that outputs from Target Finder, such as source and site EUI, are approximate numbers that should only be used during early design phases. These performance targets are only starting points and require further refinement when energy model data is available. |
Source vs. site energy
A building’s ENERGY STAR score is derived from source EUI, but design teams are more often familiar with site energy, which is the energy use that can be found on utility bills. Site EUI is translated to Source EUI using Site-to-Source conversion factors. EPA’s Technical Reference on Source Energy factors is accessible online where all Site-to-Source conversion factors are defined and explained. At present, projects must use these default factors.
Assumed site fuel mix ratio
To convert the target ENERGY STAR score from source EUI to site EUI, there is another factor the design team must consider: the Assumed Site Fuel Mix Ratio. This ratio is the comparative use of fuels used on-site, which are most commonly electricity and natural gas. Source EUI is directly impacted by this ratio since the source conversion factors are not equal. When a project has energy data from a model, Target Finder will default to the user’s data inputs rather than the assumed fuel mix.
Implications for Target Site EUIs of all-electric buildings
The Target Finder tool defines both source EUI based on the target ENERGY STAR score and also calculates target site EUIs based on the default assumed fuel mix of the building typology. The fuel mix of a building can have a major impact to the source EUI and the resulting ENERGY STAR score and site EUI.
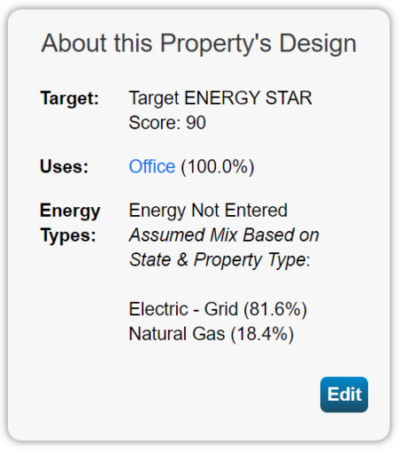
Portfolio Manager screenshot courtesy of Steven Winters Associates, Inc.
All-electric buildings, for example, require site EUIs to be 10-20% less than that of the mixed-fuel assumptions provided in Target Finder since the source conversion factor is higher for electricity use than natural gas use. However, electric heating equipment, such as heat pumps, have equipment efficiencies 3 times that of their gas counterparts, which will most often makes up that differential in an all-electric building. In addition, all-electric buildings may have lower first-costs than gas in some scenarios and they better align with District decarbonization goals, to be carbon neutral by 2050.
The two most common site-to-source conversion factors by fuel type, as defined by the EPA are listed below.
| Fuel Type | Conversion Factor |
|---|---|
| Electric | 2.8 |
| Gas | 1.05 |
Extrapolating high-performance target range
A design team can use Target Finder to identify a range of high-performance targets. It’s often helpful during early design phases to understand the range of performance targets that are both applicable and possible for the project. Below is an outline of approximate minimum site EUI targets for various typologies to achieve high ENERGY STAR scores.
Note: the data are for representative purpose only. It is the responsibility of project teams to confirm energy performance targets for their projects.
| Building typology | Target ENERGY STAR score | Source EUI target | Site EUI target using assumed fuel mix ratio | Site EUI target for 100% electric |
|---|---|---|---|---|
| Office | 90 | 93.9 | 37.9 | 33.5 |
| K-12 school | 90 | 63.6 | 28.2 | 22.7 |
| Hotel | 90 | 90.1 | 41.6 | 32.2 |
| Multifamily | 90 | 76.4 | 33.9 | 30.8 |
| Building typology | Target ENERGY STAR score | Source EUI target | Site EUI target using assumed fuel mix ratio | Site EUI target for 100% electric |
|---|---|---|---|---|
| Office | 80 | 121.7 | 49.1 | 43.5 |
| K-12 school | 80 | 77.2 | 34.2 | 27.6 |
| Hotel | 80 | 105.1 | 48.5 | 37.5 |
| Multifamily | 80 | 86.1 | 38.2 | 30.8 |
Building owners who push design teams to achieve high-energy performance building designs with lower site EUI targets early in the design phase will be well positioned to exceed the BEPS thresholds. These targets can and should be tested as the energy model is developed during future design phases. Building owners and design teams should evaluate not only compliance with the District’s energy codes, but also overall building performance in the modeling program. Once a project team is fully engaged, the next step is to evaluate building loads with a simple box model.
Conceptual design: develop a simple box model
Shoebox or simple box energy models
Energy models are useful beyond meeting the requirement to get a building permit in the District; when applied effectively throughout the design process, they can help with design decision making and maintain energy performance targets. Early energy modeling in the conceptual design phase can inform a design team of the anticipated energy use, primary loads of a building as well as highest energy end uses. This early design phase model can also be used to refine the energy performance target.
Early modeling is often referred to as a simple box, or shoebox, energy modeling. It is intended to be a “sketch” of the potential energy use, and several modeling programs have developed tools to test the sensitivity of performance of primary design components and systems on energy use. These sensitivity analyses are great indicators of what components and systems should be focused on to achieve the highest performing building.
ASHRAE Standard 209 is an energy modeling standard which defines the minimum requirements of energy simulation throughout the design process. This standard requires simple box models to achieve the following:
- Identify distribution of energy by energy end uses
- Evaluate sensitivity of building system and component performance to overall building energy use
- Investigate demand characteristics
The overall intent is to evaluate the impact of the passive variables and components of the building and reduce overall building loads—HVAC systems should be fixed in this analysis. The shoebox or simple box modeling occurs in conceptual design to understand these energy loads and the most impactful strategies to reduce those loads. It is also a powerful tool to confirm the potential energy performance of the building relative to the target site EUI range extrapolated from Target Finder.
It should be noted that the shoebox or simple box modeling process alone is not code compliant for obtaining a building permit in the District. A more detailed energy model should be developed and integrated into an iterative design process, which should result in a model sufficient for permitting.
Common simple box energy modeling tools
Two simple box modeling tools available for architects during early design phases to conduct early energy analyses, which integrate into commonly used architectural design programs, include
- REVIT Insight 360
- Rhinoceros (Rhino) Plugins
REVIT Insight 360
Insight 360 is an integrated cloud-based energy optimization and analysis tool for REVIT software. It is a free tool which comes with any REVIT subscription. REVIT is a powerful building information modeling program which tracks material and system information throughout a design. It also tracks building typology, space type definitions, and applies basic building operation assumptions within the model based on these definitions. When a project design team activates Insight 360, the material, system, building, and space type information already defined in the model is exported into the cloud to evaluate hundreds of performance options of key building components and attributes to determine the potential energy performance range of the project. When used correctly, the tool can be used to determine the energy impacts of simple design decisions, resulting in simpler, and less costly, upgrades.
An initial upload and analysis of the Insight 360 tool results in a wide range of energy performance values. There are over 20 different building characteristics or components for which several incremental performance values have been analyzed, such as window and wall performance by façade, window-to-wall ratios (WWR) by façade, operation and occupancy schedules, equipment and lighting densities, shading, and daylighting. Each feature is showcased individually along with the related sensitivity analysis. The range of performance showcased in the software represents the full dataset with the sensitivity analyses. This range can be narrowed within the program as incremental performance options are narrowed by the user for each feature.
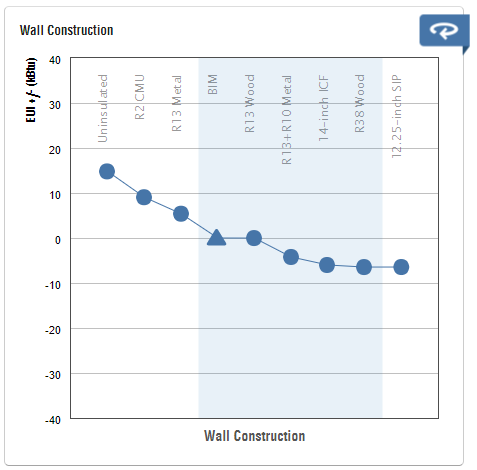
Sample Insight 360 screenshots courtesy of Steven Winter Associates, Inc.
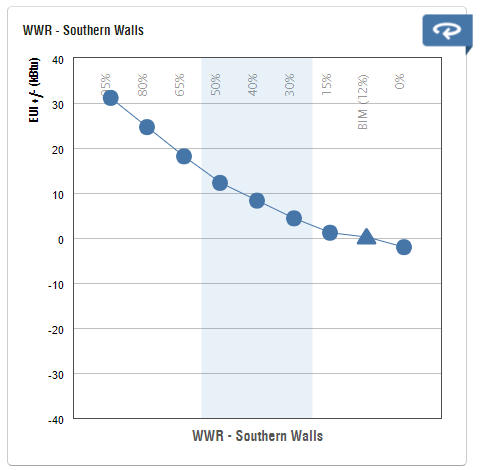
Sample Insight 360 screenshots courtesy of Steven Winter Associates, Inc.
For example, the WWR has a high sensitivity to site energy performance in the example building below, where the differential between 40% WWR and 20% WWR on the south façade alone is about 5 kBTU/sf/yr. However, the opaque envelope performance across the entire above grade wall has a relatively low sensitivity; the site EUI differential from a code-compliant wall assembly (R-13+ R-10 c.i.) to a robust assembly (R-38) represents only about 2 kBTU/sf/yr. This comparison demonstrates that there is more potential in reducing energy load on the building through glazing reduction on one facade than through improving the entire opaque wall assembly, even to R-40 levels.
A user of the tool can also develop multiple performance options based on which components are optimized and by how much. The performance metric can also toggle between site EUI and annual energy cost per square foot. Below is a summary output for a daycare facility whose site energy performance range was estimated to be 45-57 kBTU/sf/yr with cost effective energy efficiency recommendations.
Further information about the Insight 360 tool is available as a PDF. There are also free training videos for this tool including this introduction video.
Rhinoceros (Rhino) Plugins
Rhinoceros (Rhino) is a 3D modelling software. Grasshopper is a visual scripting environment that runs within Rhino. Analysis tools such as Ladybug and Honeybee are plugins with a suite of tools to visualize climate information as well analyze daylighting, thermal comfort, and annual energy use of buildings.
The Ladybug suite of tools is focused on analyzing and visualizing climate data. This helps in early stages of design to understand context of sun-path, wind, shade, and radiation for the project.
The Honeybee suite of tools connects the climate analysis capability of Ladybug to several external energy modeling engines to allow for highly detailed analysis of a building’s performance. These external engines include Radiance and Daysim for daylighting and glare studies, THERM for thermal comfort and heat flow analyses, and EnergyPlus and OpenStudio for yearly energy consumption.
The Grasshopper environment allows for the simultaneous use of these and other tools with the ability to run many cases parametrically. For a simple box model, a set of parametric inputs can be loaded into lists or sliders with the ability to run all scenarios in succession, with automated output of results and visualizations. Depending on the stage of design, generic algorithms or other methods can be used to generate inputs, analyze results, and find the optimal combinations of inputs based on a pre-determined goal such as the lowest possible energy consumption.
For example, the following project was looking to reduce solar heat gain and glare in an office space by utilizing vertical, external fins or louvers. The team wanted to understand the tradeoff between louver projection depth and rotation angle on daylighting, glare, and total solar heat gain. For this analysis, a set of inputs were determined for a parametric analysis.
With the base geometry of the proposed building and surrounding buildings modeled in Rhino, the Grasshopper script was used to simulate the geometry of each of the parametric runs based on the inputs provided. A loop tool within Grasshopper allows for successive calculation of scenarios until all inputs are exhausted with automatic recording of results in excel and generation of images for each scenario.
With the base geometry of the proposed building and surrounding buildings modeled in Rhino, the Grasshopper script was used to simulate the geometry of each of the parametric runs based on the inputs provided. A loop tool within Grasshopper allows for successive calculation of scenarios until all inputs are exhausted with automatic recording of results in excel and generation of images for each scenario.
As each scenario is simulated within Grasshopper, the effect on daylighting, glare, and solar heat gain are calculated simultaneously to and the results are output automatically.
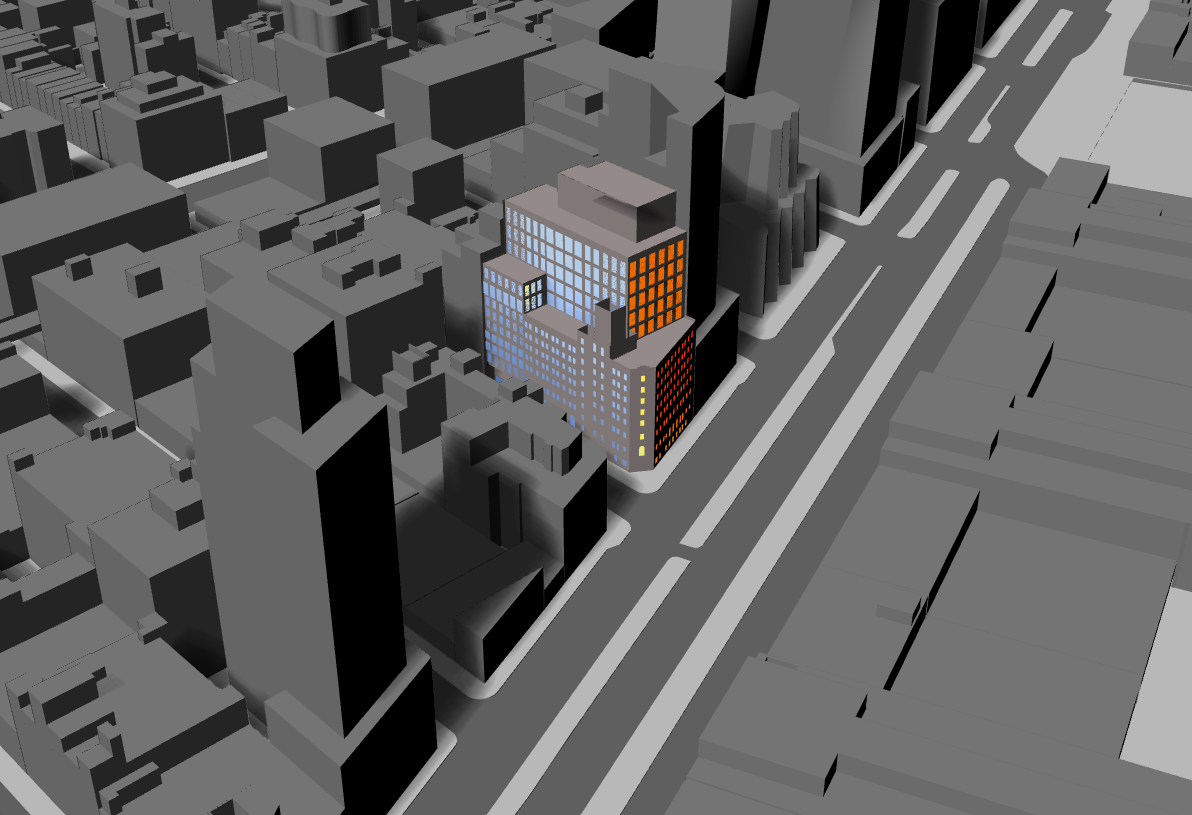
Sample Rhino model visualizing insolation on building using Ladybug plugin features courtesy of Steven Winter Associates, Inc.
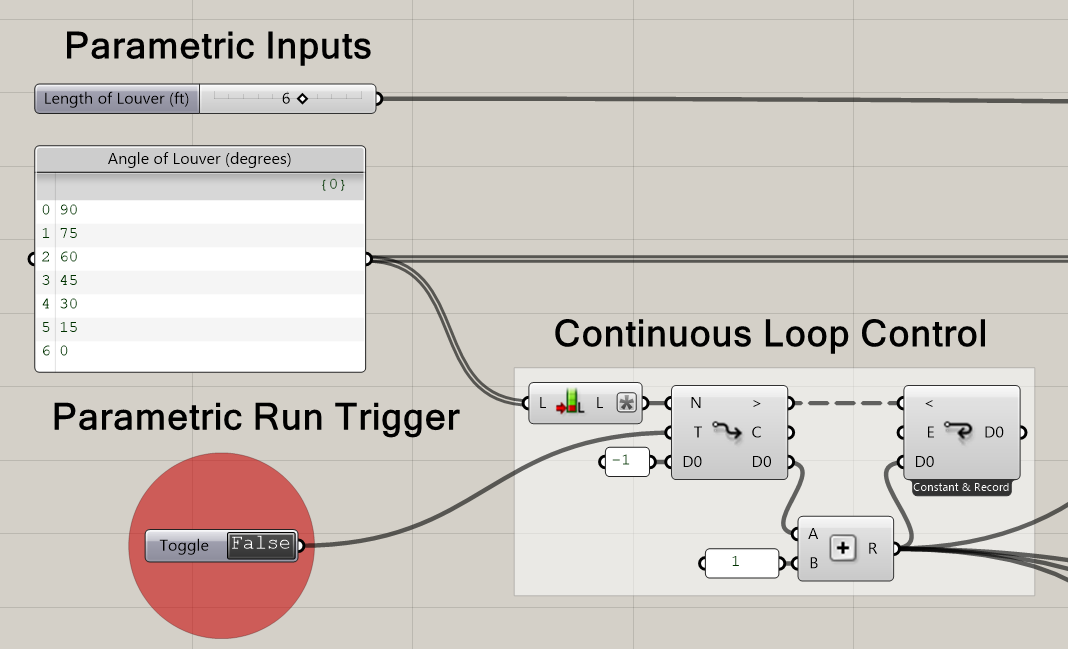
Sample Grasshopper work-flow courtesy of Steven Winter Associates, Inc
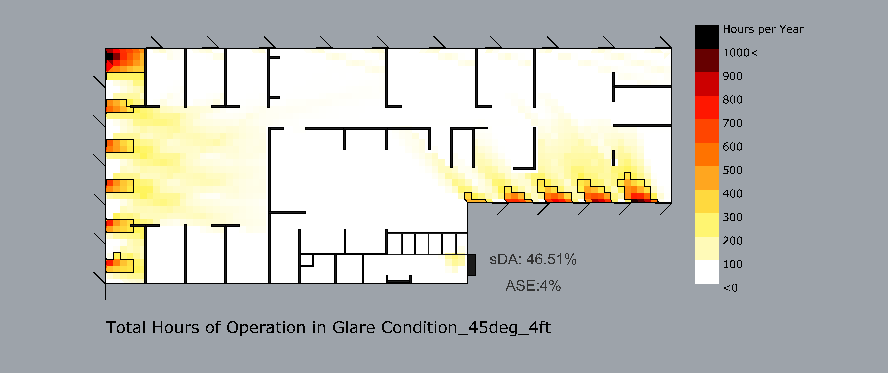
Sample Rhino daylighting study using Grasshopper and Ladybug courtesy of Steven Winter Associates, Inc.
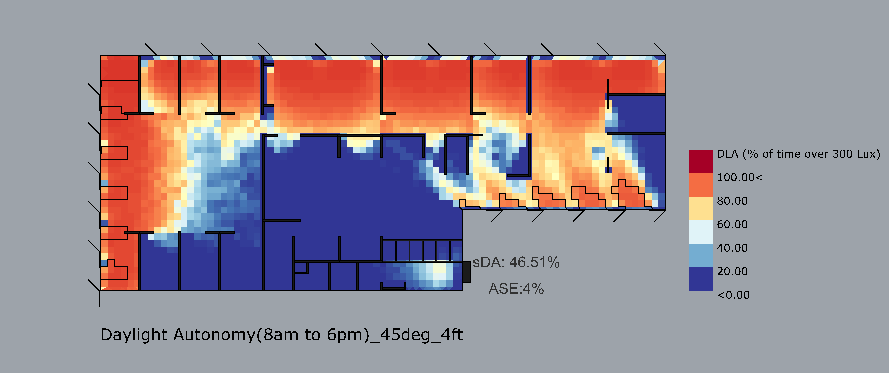
Sample Rhino daylighting study using Grasshopper and Ladybug courtesy of Steven Winter Associates, Inc.
Below is a list of additional training resources for the Rhino workflow for early energy analysis:
- Rhino video tutorials are available from the company website and on Vimeo, and the latter is best for someone who has working experience with Sketchup
- Grasshopper tutorials can be found on Vimeo.
- Ladybug and Honeybee tutorials can be found on the company website.
- Example files which demonstrate the capabilities of these tools can be found on Hydra.
Conclusion
Upon completion of the two steps outlined above for both the pre-design and conceptual design phases, an owner and design team will have both established an energy performance target for the project and refined design strategies to ensure successful achievement of that target throughout the rest of the design process. The energy performance target is established in the pre-design phase using Target Finder, and design strategies to achieve the target are refined during conceptual design with the simple box energy modeling process.
While these first two steps are essential for high-performance buildings, energy performance evaluation must continue throughout the rest of the design, construction, and operations process. In the subsequent design phases, the design team must work together to continue to optimize performance at a more detailed level within each system while also maintaining high-performance as a holistic building. This process requires continued iteration and evaluation of energy performance through integrated energy modeling. At each stage, the energy performance target should be verified to ensure the building is in alignment with the goals set in the pre-design phase. Energy performance should continue to be confirmed through construction with good quality commissioning, and then proven via benchmarking once a building is occupied and operational. Further, in order to continually improve performance in future buildings, owners and design teams should pay attention to the energy performance of recently built projects. These insights can be integrated into the design process for future projects.
Further resources for energy efficient buildings
There are several free design tools available which outline energy efficiency strategies by building type. Below are a few of these resources:
- ASHRAE’s Advanced Energy Design Guides. These guides were developed by several professional organizations for multiple building typologies and are free for download.
- New Building Institute’s Multifamily Building Guide. This is a best practice guide for energy reduction specific to the multifamily market.
- The American Institute of Architects’ (AIA) Framework for Design Excellence is a compilation of principles that represent high quality design. Among the categories is Design for Energy. This outlines best practice design processes, identifies high impact targets, and additional resources and case studies which further demonstrate potential for energy reduction in new construction.
- Architecture 2030 has been an industry leader in providing resources about reducing energy use in buildings. They have assembled many research papers and outlined targets to achieve carbon zero by 2030. They have also developed several tools to assist design teams in achieving high performance buildings including:
- Design firms who have committed to the 2030 Challenge can track designed energy performance in the Design Data Exchange tool; this tool is also supported by AIA. This tool can help design teams compare projects over time, and continually improve design strategies and processes to reduce energy use in their designs.
- The 2030 Palette includes a wide variety of design strategies which can reduce energy use in buildings, taking into account building location and orientation. Additional resources and case studies are provided for further understanding and application.
- ASHRAE Standard 209, Energy Simulation Aided Design for Buildings except Low Rise Residential Buildings, is helpful for teams to understand the value of energy modeling at each phase of a development. This standard can be helpful when identifying the scope of work for energy modeling within a project schedule.